
Everything You Need to Know About Your Mac’s Activity Monitor
 tinhkhuong / Shutterstock
Toggle Dark Mode
The Activity Monitor on Mac is one of those tools that we don’t commonly use, and for good reason.
If our Macs are working perfectly, we might not see the need to use the Activity Monitor since everything seems to be going so well. Still, the Activity Monitor will give you a better, more accurate analysis of what’s going on inside your computer. It might even help you understand why your Mac isn’t working as it used to.

Whether you’ve used the Activity Monitor before or it’s your first time hearing about it, here’s how you can start using it on Mac.
What Is the Activity Monitor?
The Activity Monitor is a Mac app that helps examine your Mac’s performance and power consumption.
This app lets you see the CPU and GPU usage, as well as which apps are using the most energy on your Mac, and close the ones that are being a little too demanding. You can also use it to determine if your Mac needs more RAM or not.
Basically, this app will let you control everything related to your Mac’s performance without you being a tech-savvy person. While there are many things you can do with your Activity Monitor, we’re going to look at the most important features you can use.
How to Open the Activity Monitor
Since the Activity Monitor is an Apple app, you can quickly find it on your Launchpad. All you need to do is access the Launchpad—either by clicking the icon on the Dock or using the F4 key on your Mac—and search for the Activity Monitor app.
However, there’s an even quicker way for you to do it. All you need to do is press the Command key and the spacebar at the same time to open the Spotlight Search. Then you can enter Activity Monitor and hit the Return key. Your Mac will automatically open Activity Monitor without you searching for the app.
How to View CPU Activity in Activity Monitor
Your Activity Monitor will show you an accurate representation of the CPU activity on your Mac. You can view the current activity or the most recent processor activity to help determine what’s using the most CPU on your Mac.
- Open the Activity Monitor app.
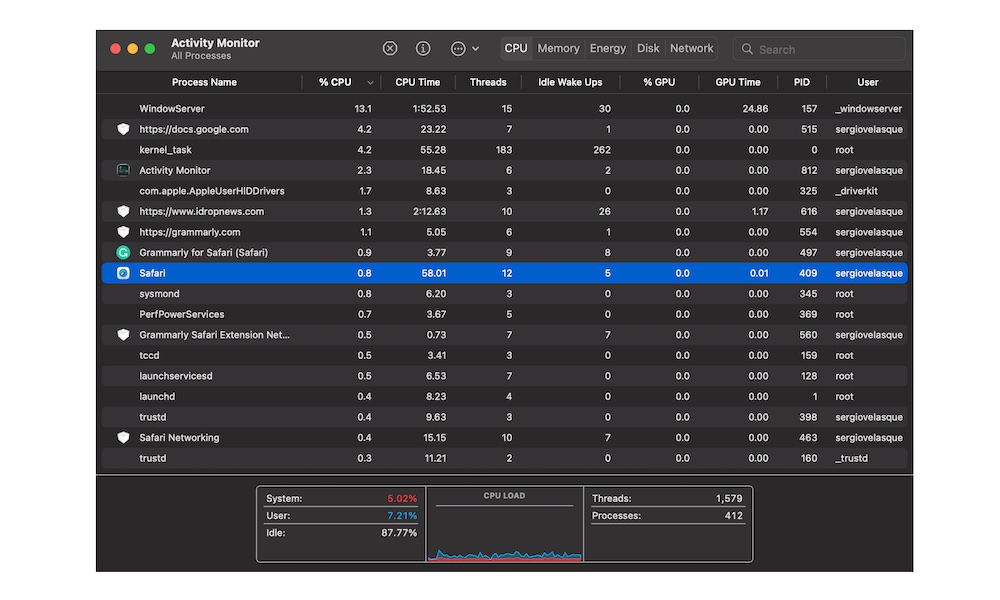
- Click the CPU tab at the top of the window.
- Look at the bottom of the window to see more information about your CPU activity.
There’s a lot of information at the bottom. First, you’ll notice numbers in red, blue, and white colors. The red color represents the percentage of CPU capability being used by macOS processes. This means you have nothing to do with it.
The blue color is all about the user. It shows a percentage of CPU capability that’s being used by apps you opened, or by processes that are running on other apps.
Last but not list the white color, which also says, Idle. This represents the percentage of CPU capability that’s not being used at the moment.
If you want to see the recent processor activity, you need to click Window > CPU History. And to go back to the current activity, click Window > CPU Usage.
How to Close an App in Activity Monitor
If you see an app is taking a lot of CPU power out of your Mac, you might want to immediately close it. You can close it the normal way by clicking on the red X button in the top left corner of your screen, but if the app is unresponsive, you can use the Activity Monitor to close it.
- Open Activity Monitor.
- Make sure you’re on the CPU tab.
- Select the app you want to close.
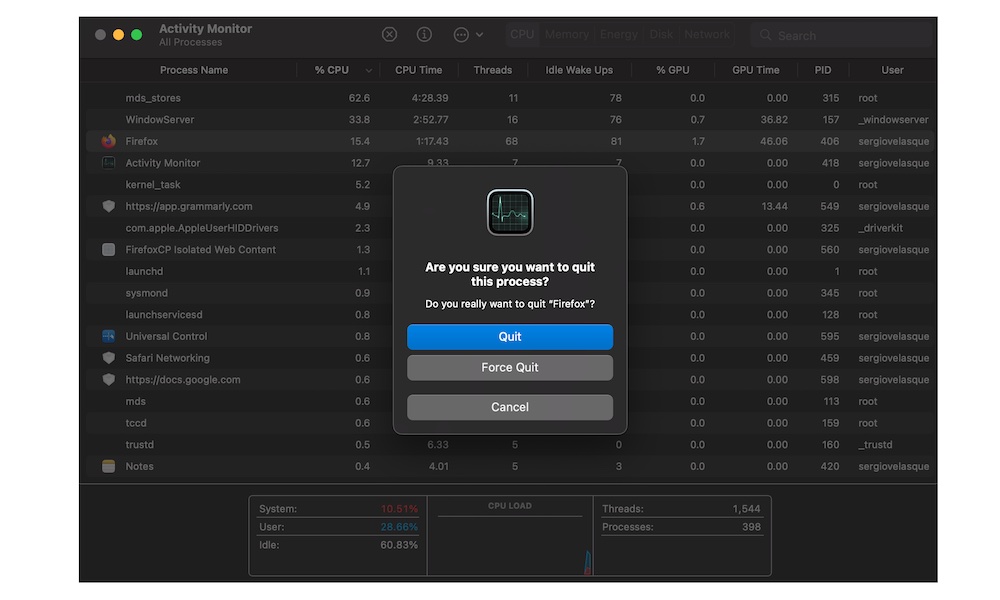
- Click the Stop button in the upper left corner of the window. It’s the button with an X inside an octagon.
- Choose one of the options to close the app.
You can choose Quit, which is the same as closing the app properly, or you can select Force Quit, which will immediately quit the app. The latter it’s the better option if the app gets stuck or is unresponsive.
See Which Apps Are Using the Most Energy
If you’re running low on battery on your MacBook, you might want to close the apps that are using the most energy. Fortunately, with Activity Monitor you can quickly find which apps are doing just that.
- Open the Activity Monitor app.
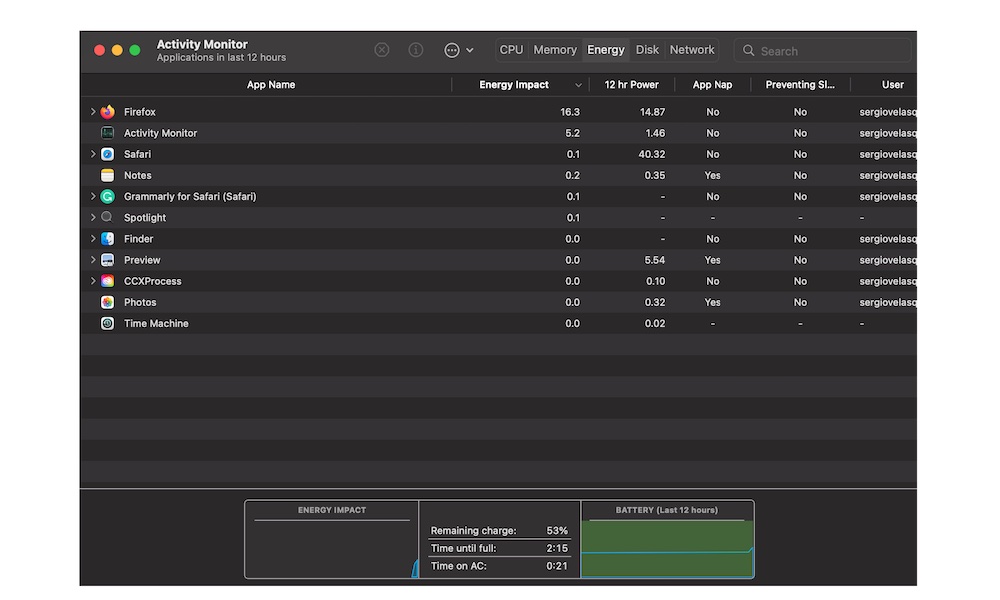
- Click on the Energy tab at the top of the window.
- Click the Energy Impact column to sort the apps by the most demanding.
The Energy Impact column will show you, well, the energy impact an app’s having on your Mac. The lower the number, the better.
There’s also a column that says 12 hr Power, and that’s the average energy impact an app has had in the last 12 hours.
The column that says Preventing Sleep shows you if the app prevents your Mac from going to sleep when you’re not using it.
If you see that an app is taking too much energy from your Mac, you can select it and close it as we previously showed you.
Understand the Memory Pressure on Your Mac
The Activity Monitor also shows you how the RAM on your Mac’s being used. You can see if your Mac’s memory pressure is working as expected. And if it isn’t, it’s possible that you need more RAM in your Mac.
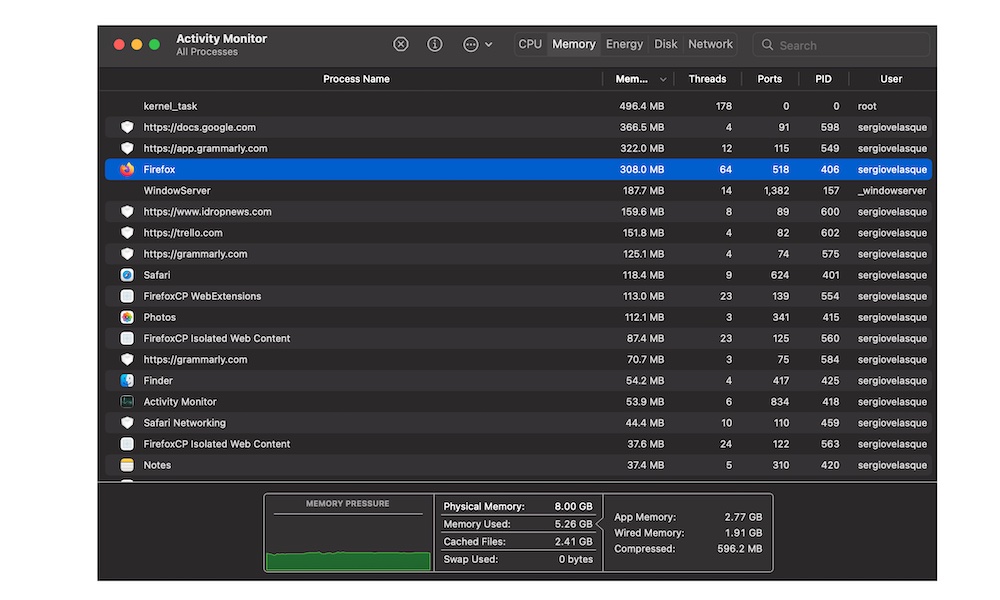
- Open the Activity Monitor.
- Click on the Memory tab at the top of the window.
You can use the graph at the bottom to determine your memory pressure. If the pressure is green, your Mac’s using its RAM efficiently. If it’s yellow, it may need more RAM in the future. And if it’s completely red, it means your Mac is at its limit.
Of course, this can happen because of an app that’s using too much of your memory, so you can try quitting the app and see if that does the trick. However, if you’re planning on using that app, you might need to consider more RAM.
How to See a Real-Time Status in the Dock
You can change the Activity Monitor icon to show you a real-time status right on your Dock. You can change it, so it shows you a CPU, Network, or Disk status without opening the app.
First, make sure to add the Activity Monitor app to the Dock. You can do this by pressing the Command key and the spacebar to open Spotlight Search. Then enter Activity Monitor and when it appears in the search results, click and hold the app. Drag it to your Dock and release it where you want it to be. Then follow these steps:
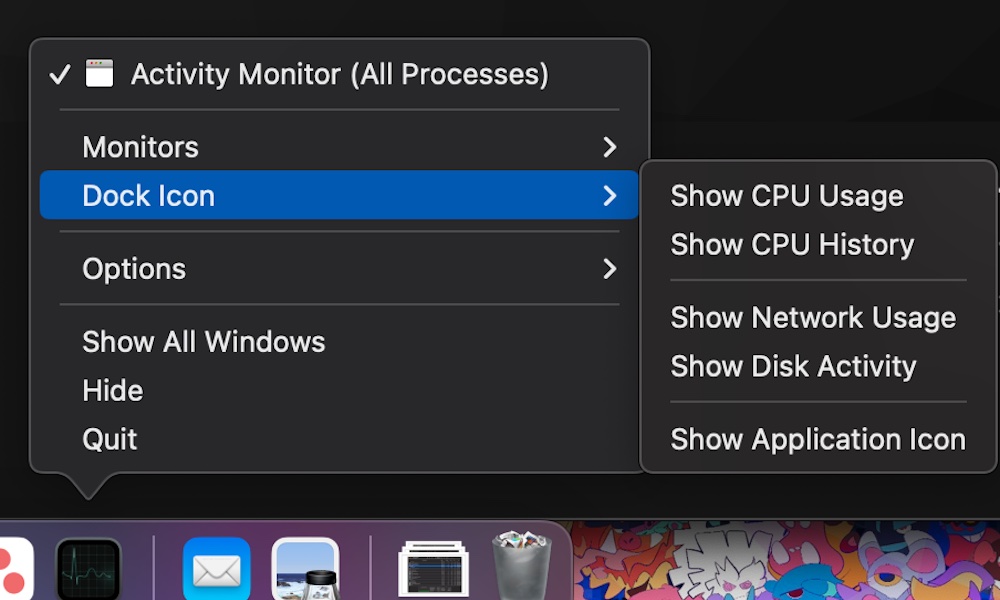
- Right-click the Activity Monitor.
- Click on Dock icon.
- Select what you want the Activity Monitor icon to show. You can choose CPU usage, CPU history, Network Usage, and Disk Activity.
And that’s it. That’ll show you a real-time graph. Albeit it’s a bit small, it can still be pretty useful to have. Plus, you can always follow the same steps and change the status you want to see.